Like everyone else all over the world, for the last four months I’ve been working from home and limiting my trips out out of the house. But the situation these last four months has not been entirely unwelcome (except of course for people getting sick). For one thing, the view from my home office of trees and mountains is immensely better than the windowless building in which I was working. And for another thing with no commutes and flexible schedules, I have gained several additional hours in my day for doing things I want to do. With all I new found time, I did what any responsible technical person would do in such uncertain times. I’ve been teaching myself some new skills.
One of those new skills I’ve been teaching myself is data analytics programming in the computer language Python. If you are unaware, Python is an open source computing language, first released in 1991, the usage of which has become very widespread. It is extremely powerful due to its design features and philosophy and has become a standard capability in most software programmers’ skill sets. However I was stuck with how I, a definite non-software programmer, was going to proceed.
So instead of following a bunch of silly tutorials programming things in which I had no use or interest, I decided to tackle some vacuum tube calculations. This would allow me to learn the intricacies of the language, it structures, syntax, rules, & peculiarities while tackling numerical problems with which I was very familiar. These are things I normally do with spreadsheets, but that I could do equally well with self contained programming tools with GUI interfaces. After thinking about it for a little while, I became preoccupied with giving this a try.
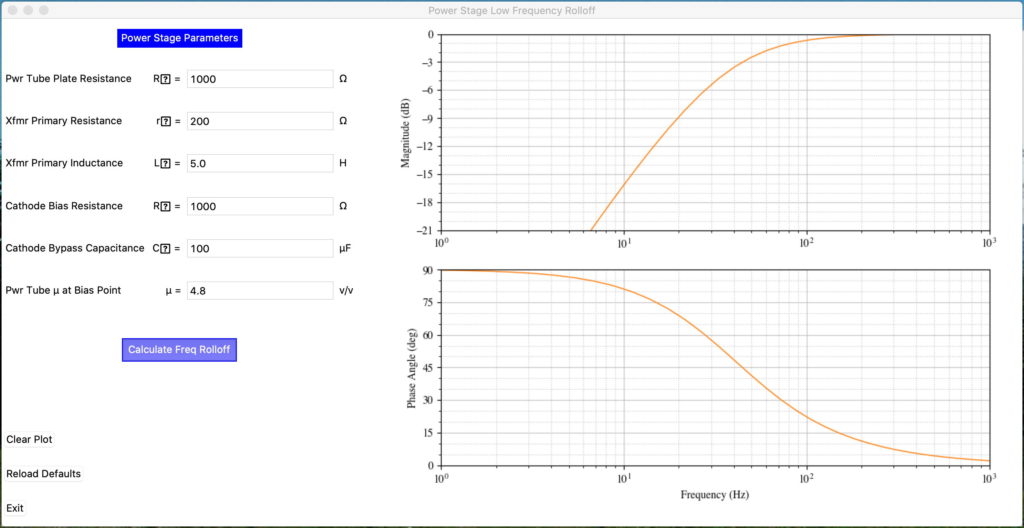
The first thing I attempted was a tool for calculating the low frequency roll off of SET output stages. This is a nice simple problem with which to start because it’s only dependent on a handful of parameters and is easily calculated. This problem allowed me to build GUI interfaces, perform mathematics with large vectors, plot responses, and learn to control the overall program initialization and execution. So this is what the first tool looks like.

This tool takes the six simple parameters on the left and generates the theoretical gain and phase of the SET power stage low frequency response. The user can change parameters and plot additional lines, allowing one to explore how changes in the parameters affect the roll off. It is by no means finished, but the image shows what I was thinking.
While I was playing with this, I got to thinking that maybe other people could make use of tools like this. This was just a learning opportunity for me, but why not let other people benefit from my work. So I’m asking the question: Do the other vacuum tube people think this type of program would be useful? If the answer is yes, then I will continue forward with this tool and generate a self contained application which others can download from my website. Then I can add other tools as I have time and opportunity.
Let me know what you think.

I’m a bit late to this but I think it would be a great tool to have in the diy arsenal. Depending how user friendly it could help the non mathematically inclined (cough) better understand effect of component choices.
Yes, I haven’t addressed this in a while because of an unexpected hitch. The tool itself reflects the theory properly and returns the results I expect. However, the predictive voracity of the tool is currently in doubt. I suspect that the issue is the correct assessment of the output transformer primary inductance at low frequency while in the circuit. I do not trust the numbers published (when they are available) by the manufacturers because they are not predictive in actual circuits. So I was attempting to develop a measurement approach to properly express the primary inductance in circuit.
I believe the secondary load is the issue. I can see differences in primary inductance at low frequency dependent on load (open/resistive/speaker) in actual test, but I have not arrived at a sufficiently accurate model to use in the tool. Until I do, the predictive power of the tool will be limited. It may be that I have to include speaker parameters in the tool as well.
Matt – this looks very cool! Have you by any chance put the code on Github?
No. To be honest I haven’t look at this in a while. And I’ve never actually used Github.
I have used similar on line programs for speaker system design. Found them to be very helpful. Makes it easy to match drivers and enclosures.
Definitely a good idea!!
Definitely useful. I’ve used python, numpy, scipy and Jupiter notebooks for years for my tube amp design process. You’ve choosen well, the py world is awesome. Look for me by name on youtube. You can contact me personally also. If you need any help, which you may not. Looks like you got the gist of it. Thanks for the post, good luck and have fun.
Thanks for the encouragement. I’ve still got much to learn but I feel like I’m making steady progress. I’m still a little fuzzy on the Jupiter Notebooks approach but my Software Architect at work tells me it’s the way to go so I’ll be doing some more reading and experimenting in that arena as well. It’s been really interesting so far. Quite a stretch for an old guy firmly routed in ‘C’ and ‘ADA’. I guess it is possible to teach an old dog new tricks!